In today’s fast-paced business world, project visibility is everything. Whether you’re managing a marketing campaign, tracking engineering sprints, or monitoring sales performance, being able to see real-time progress across multiple projects in one place is essential. This is where Monday.com Dashboards come in — providing a powerful, visual way to analyze your team’s work and make smarter, data-driven decisions.
Top 5 Project Management Software
✅ What Are Monday.com Dashboards?
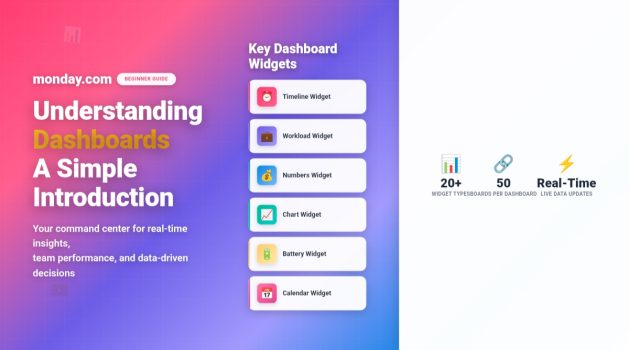
Monday.com Dashboards are centralized visual spaces that consolidate data from one or more boards into a single, interactive view. They act as your command center, giving you instant insights into team performance, workloads, budgets, and timelines.
Think of dashboards as your team’s mission control — a high-level overview that helps leaders track metrics, identify roadblocks, and stay on top of project health without diving into every individual task.
Each dashboard can display data from up to 50 different boards, meaning you can monitor company-wide KPIs, project timelines, budgets, and workloads — all in one unified view.
✔️ Why Dashboards Matter in Project Management
Dashboards play a vital role in transforming raw project data into actionable insights. Here’s why they’re indispensable for modern teams:
- Visibility: They provide a bird’s-eye view of progress and performance across multiple projects.
- Accountability: Each widget reflects measurable outcomes, helping teams stay responsible for results.
- Efficiency: Dashboards eliminate the need for manual reporting by pulling live data automatically.
- Data-Driven Decisions: You can track metrics like time, cost, and resources to identify patterns and improve forecasting.
- Customization: Every dashboard is adaptable to your needs — from executive overviews to detailed team analytics.
➡️ How to Create a Dashboard in Monday.com
Creating a dashboard in Monday.com is a straightforward process. Here’s how you can set one up:
- Navigate to the Dashboard Section:
From the main workspace, click the “+ New” button on the left panel and select Dashboard. - Select Connected Boards:
Choose which boards you want to pull data from — these might be projects, campaigns, or workflows. - Add Widgets:
Widgets are the building blocks of your dashboard. Each one serves a unique purpose — for example, tracking time, displaying charts, or showing workloads. - Customize Layout:
You can easily drag and drop widgets to design your dashboard layout, giving priority to what matters most. - Share with Your Team:
Dashboards can be shared publicly within your workspace or privately with specific teammates.
📊 Key Dashboard Widgets You Should Know
Monday.com offers more than 20 different widgets, allowing you to tailor your dashboard to your unique needs. Here are the most commonly used ones:
🕓 Timeline Widget
Visualize project schedules and deadlines at a glance. Ideal for spotting potential bottlenecks and ensuring projects stay on track.
💼 Workload Widget
See how work is distributed among your team members. This widget helps balance responsibilities and prevent burnout.
💰 Numbers Widget
Track financial metrics, budgets, or KPIs. You can connect it to cost or revenue columns and visualize totals automatically.
📈 Chart Widget
Turn data into colorful bar, line, or pie charts to analyze performance trends and make informed decisions.
📬 Battery Widget
Gauge project health with an easy-to-read visual bar that shows the percentage of completed tasks.
📅 Calendar Widget
Sync project deadlines into one unified calendar view to never miss a critical milestone.
📋 Table Widget
Display data from multiple boards in a single table, great for quick comparisons or management overviews.
☑️ Real-World Use Cases for Monday.com Dashboards
Here’s how different teams use dashboards effectively:
🧩 Project Managers
Project managers use dashboards to oversee timelines, budgets, and team performance. They can spot late tasks early and allocate resources strategically.
📣 Marketing Teams
Marketers visualize campaign KPIs — such as engagement, conversions, and ad spend — to ensure campaigns deliver measurable ROI.
💻 Software Developers
Tech teams track sprint velocity, backlog size, and release progress in real-time.
🧮 Finance Teams
Dashboards help financial teams monitor expenses, revenues, and forecast variances at a glance.
👥 HR and Operations
Human resources use dashboards to track recruitment pipelines, onboarding progress, and employee performance metrics.
⚙️ Customizing Dashboards for Maximum Insight
To get the most out of Monday.com dashboards:
- Use filters to focus on specific timeframes or team members.
- Add automation so updates reflect instantly without manual input.
- Integrate with tools like Google Sheets, Slack, or Excel for extended reporting.
- Group widgets logically — for example, place KPIs at the top, team workload in the middle, and timelines at the bottom.
By customizing views and layouts, you ensure that every stakeholder gets the right information at the right time.
📘 Tips for New Users
- Start simple — focus on 3–4 widgets that reflect your main project goals.
- Avoid overcrowding — clarity is better than complexity.
- Name your dashboard clearly ( “Marketing KPIs – Q4 2025”).
- Schedule a weekly review with your team to discuss insights and make adjustments.
🧭 Final Thoughts
Monday.com Dashboards make it effortless to see the full picture of your projects — from deadlines to workloads to budgets — all in one dynamic workspace. For new users, dashboards are the fastest way to turn project data into strategy, keeping everyone aligned and informed.If you’re just starting out, don’t worry about mastering everything at once. Begin with a few widgets, explore what’s most valuable to your team, and evolve your dashboard as your needs grow. Over time, it will become your most trusted decision-making tool.
Try Monday.com’s Starter Plan for Free
Experience all the essential tools you need to organize your work, collaborate with your team, and stay on track — no credit card required.