
➡️ Introduction
Key Performance Indicators (KPIs) are the backbone of performance measurement in project management.
They help project managers understand whether the project is progressing as expected, whether teams are performing effectively, and whether strategic goals are being achieved.
Top 5 Project Management Software
Without well-defined KPIs:
❌ progress becomes subjective
❌ decision-making loses accuracy
❌ stakeholders rely on assumptions
❌ teams focus on activity rather than outcomes
This guide provides a deep, practical, and systematic approach to defining KPIs that actually drive results.
✅ What Are KPIs in Project Management?
KPIs are quantifiable performance measures used to evaluate progress toward specific project goals.
A strong KPI must be:
✔️ measurable
✔️ relevant
✔️ time-bound
✔️ aligned with strategic objectives
✔️ actionable
KPIs transform vague expectations into clear success criteria.
✅ Why KPIs Matter
Well-designed KPIs help project managers:
✔️ track real performance against plans
✔️ identify early warning signs
✔️ uncover inefficiencies
✔️ hold teams accountable
✔️ make data-driven decisions
✔️ communicate status clearly to stakeholders
KPIs turn project progress from guesswork into evidence.
✅ Types of KPIs Used in Projects
Project KPIs typically fall into four main categories:
✔️ 1. Schedule KPIs
Evaluate how well the team follows the timeline.
Examples:
- Schedule Variance (SV)
- Milestone completion rate
- On-time task delivery percentage
✔️ 2. Cost KPIs
Monitor financial performance.
Examples:
- Cost Variance (CV)
- Burn rate
- Actual Cost vs Planned Cost
✔️ 3. Quality KPIs
Measure deliverable quality and compliance.
Examples:
- Defect density
- Rework percentage
- Client-reported issues
✔️ 4. Scope & Requirements KPIs
Track how well the project adheres to scope.
Examples:
- Requirements completion rate
- Scope change percentage
- Feature acceptance rate
✔️ 5. Team Performance KPIs
Assess productivity and resource utilization.
Examples:
- Team velocity
- Utilization rate
- Workload balance
✔️ 6. Stakeholder Satisfaction KPIs
Measure alignment and approval.
Examples:
- Stakeholder satisfaction score
- Communication effectiveness score
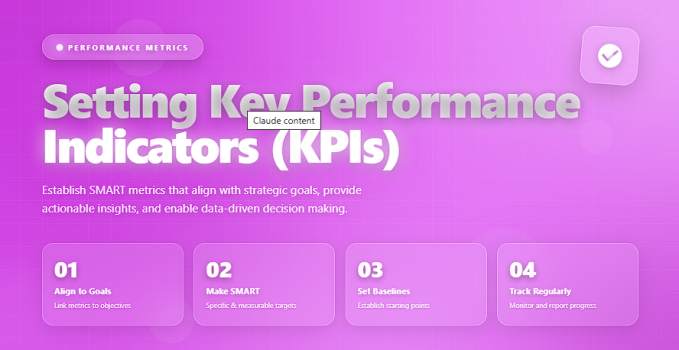
✅ How to Set Effective KPIs (Step-by-Step)
Below is a professional, practical roadmap for defining KPIs that truly reflect project success.
✔️ Step 1: Start with the Project Objectives
Every KPI must directly support a business or project objective.
Examples:
- Deliver the project within 6 months
- Improve product reliability by 30%
- Reduce operational costs by 15%
Objectives → KPIs → Measurements
This alignment ensures relevance.
✔️ Step 2: Choose the Critical Success Areas
Ask:
➡️ What areas determine success for this project?
Common areas include:
- timeline
- cost
- quality
- risk
- team performance
- customer satisfaction
Only measure what truly drives outcomes.
✔️ Step 3: Make the KPIs Measurable
Vague: “Improve service quality.”
Clear KPI: “Reduce defect rate from 12% to 4% by the end of Q3.”
KPIs must be:
✔️ quantifiable
✔️ trackable
✔️ fact-based
✔️ Step 4: Set Target Values
Examples:
- “Complete 90% of tasks on time”
- “Maintain budget variance below 5%”
- “Keep stakeholder satisfaction above 4.5/5”
Targets turn KPIs into commitments.
✔️ Step 5: Assign Ownership
Each KPI needs a responsible owner to:
✔️ monitor performance
✔️ report changes
✔️ implement improvements
Ownership ensures accountability.
✔️ Step 6: Define the Measurement Method
Specify:
✔️ where data comes from
✔️ how often it will be measured
✔️ how it will be displayed (dashboards, reports, charts)
Example:
“Weekly velocity measured using Jira sprint data.”
Consistency is essential for accuracy.
✔️ Step 7: Review KPIs Regularly
KPIs must evolve with the project.
Review KPIs during:
✔️ sprint reviews
✔️ monthly status meetings
✔️ quarterly planning cycles
Adjust KPIs when objectives change or new insights emerge.
⭐ Examples of Strong KPIs for Projects
Here are real-world KPI examples project managers often use:
Schedule
- ✦ Milestone completion rate ≥ 95%
- ✦ Schedule variance ≤ ±5%
Cost
- ✦ Actual Cost (AC) ≤ Planned Value (PV)
- ✦ Monthly burn rate ≤ budget forecast
Quality
- ✦ Defect removal efficiency ≥ 92%
- ✦ Rework effort < 6% of total hours
Team Performance
- ✦ Sprint velocity variance ≤ 10%
- ✦ Resource utilization 70%–85%
Stakeholder Satisfaction
- ✦ NPS or Satisfaction Score ≥ 8/10
- ✦ Communication effectiveness ≥ 90%
❌ Common Mistakes When Setting KPIs
Avoid the following traps:
❌ Too many KPIs (creates confusion)
❌ KPIs not aligned with objectives
❌ Measuring outputs instead of outcomes
❌ Data takes too much effort to collect
❌ KPIs too vague or subjective
❌ Setting unrealistic targets
❌ No owners assigned
KPIs must be simple, relevant, and actionable.
⭐ Best Practices for KPI Success
✔️ Keep the list short and high-value
✔️ Use both leading and lagging KPIs
✔️ Measure behaviors, not just results
✔️ Update KPIs as the project evolves
✔️ Visualize KPIs in dashboards
✔️ Combine KPIs with risk metrics for deeper insights
⭐ Final Thoughts
Setting effective KPIs is more than tracking numbers — it’s about creating clarity, alignment, and performance discipline.
When designed well, KPIs help project managers:
✔️ detect problems early
✔️ measure what truly matters
✔️ make informed decisions
✔️ drive accountability
✔️ deliver successful outcomes
KPIs don’t just track progress —
they guide the project toward success.