Introduction
In today’s fast-paced, data-driven business world, maintaining quality isn’t a luxury—it’s a competitive necessity. Organizations across industries—from manufacturing to healthcare to software—rely on Six Sigma to ensure efficiency, consistency, and customer satisfaction. At its core, Six Sigma is about identifying and eliminating defects, reducing variation, and improving processes.
Top 5 Project Management Software
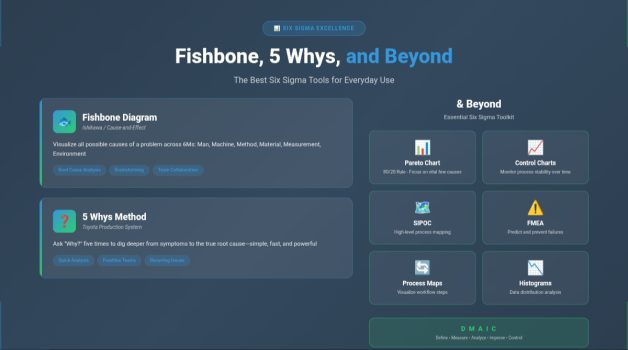
But the true strength of Six Sigma lies in its practical tools—the frameworks and techniques that empower teams to uncover root causes, analyze data, and implement lasting solutions. Among these, the Fishbone Diagram and the 5 Whys method stand out for their simplicity and power. Yet, there’s more to Six Sigma than just these two. This article explores these essential tools—and goes beyond them—to reveal how you can apply Six Sigma thinking in everyday work.
☑️ Understanding the Six Sigma Philosophy
Before diving into specific tools, it’s important to recall what Six Sigma truly represents. The term “Six Sigma” refers to a statistical measure of process variation, aiming for no more than 3.4 defects per million opportunities. But in practice, it’s a business management philosophy that combines quantitative analysis with cultural transformation.
Six Sigma follows a structured approach known as DMAIC:
- Define: Identify the problem and goals.
- Measure: Collect data and establish baselines.
- Analyze: Determine root causes of defects.
- Improve: Implement solutions to eliminate those causes.
- Control: Maintain gains through monitoring and standardization.
The Fishbone Diagram and 5 Whys are central to the Analyze phase—but their utility often extends far beyond that.
✔️ The Fishbone Diagram (Ishikawa Diagram)
What It Is
The Fishbone Diagram, also called the Ishikawa Diagram or Cause-and-Effect Diagram, was developed by Professor Kaoru Ishikawa in the 1960s. Its purpose is to visualize the possible causes of a problem and help teams explore all contributing factors systematically.
The diagram resembles a fish skeleton:
- The head represents the problem or effect.
- The spine connects all branches of potential causes.
- Each bone or branch represents a category of causes.
How It Works
The classic categories are known as the 6 Ms in manufacturing:
- Man (People) – Human factors or errors.
- Machine – Equipment or technology issues.
- Method – Process or procedural problems.
- Material – Quality or suitability of inputs.
- Measurement – Data accuracy or metrics issues.
- Mother Nature (Environment) – External influences such as temperature, humidity, or workplace conditions.
In service or knowledge industries, you might adapt this to the 4 Ps: People, Policies, Procedures, and Place.
Practical Example
Imagine a hospital noticing an increase in medication errors. A Fishbone Diagram session might identify:
- People: Nurses under pressure, lack of training.
- Method: Confusing labeling on forms.
- Machine: Software interface errors in the e-prescription system.
- Material: Similar-looking packaging.
- Measurement: No double-check system for dosage confirmation.
- Environment: High noise levels in the medication area.
By mapping all potential causes, teams visualize relationships and focus on the most impactful areas for investigation.
When to Use It
Use the Fishbone Diagram when:
- A problem’s cause isn’t immediately clear.
- You need to brainstorm causes as a group.
- You want to visually communicate how multiple factors interconnect.
✔️ The 5 Whys Technique
What It Is
The 5 Whys method is a simple yet incredibly effective root cause analysis tool that asks one question repeatedly: “Why did this happen?”
Developed by Sakichi Toyoda, the founder of Toyota Industries, this technique became a pillar of the Toyota Production System and later Lean and Six Sigma practices. The concept is to dig deeper beyond surface-level symptoms until you uncover the true root cause—usually within five iterations of “why.”
How It Works
Here’s how it typically goes:
- Identify a problem statement.
- Ask “Why did this happen?” and note the answer.
- Take that answer and ask “Why?” again.
- Continue until you reach a cause that is actionable and not just a symptom.
Example
Problem: A machine stopped working.
- Why? The fuse blew.
- Why? The machine overloaded.
- Why? The bearing was not lubricated.
- Why? The lubrication pump failed.
- Why? The pump’s filter was clogged with debris.
Root cause: The filter wasn’t being cleaned regularly, pointing to a gap in maintenance procedures.
When to Use It
- When the problem seems recurring or chronic.
- When you want a quick, team-driven analysis.
- During early project stages, before collecting extensive data.
The 5 Whys is perfect for frontline teams and daily process improvement meetings, as it requires no statistics—just curiosity and honesty.
➡️ Fishbone vs. 5 Whys: Complementary Tools
Though distinct, these tools complement each other beautifully:
- Fishbone Diagrams map out all possible causes in broad categories.
- 5 Whys then drills deeply into one or two of those causes to find the real culprit.
For example, after using a Fishbone to identify “training deficiency” as a possible cause of defects, you can apply the 5 Whys to understand why that training gap exists—perhaps due to poor onboarding design or lack of standard materials.
☑️ Beyond Fishbone and 5 Whys: Advanced Six Sigma Tools
While Fishbone and 5 Whys are great starting points, more sophisticated Six Sigma tools help teams quantify, prioritize, and validate findings. Let’s explore the most practical ones.
1. Pareto Chart (80/20 Rule)
The Pareto Principle states that 80% of problems come from 20% of causes. The Pareto Chart—a combination of bar and line graph—helps identify which issues contribute most to defects or delays.
Use Case: In a call center, a Pareto Chart may show that 70% of complaints come from only two call categories: billing errors and delayed refunds. Fixing these first delivers the greatest improvement.
2. Control Charts
A Control Chart tracks data over time to show whether a process is stable or drifting out of control. It distinguishes between:
- Common cause variation (normal fluctuation)
- Special cause variation (something unusual happening)
Use Case: A production line tracking defect rates can see when variation exceeds control limits—signaling immediate investigation before waste multiplies.
3. SIPOC Diagram
The SIPOC tool (Suppliers, Inputs, Process, Outputs, Customers) gives teams a high-level view of a process before diving into details. It’s particularly helpful in the Define phase of DMAIC.
Use Case: A retail chain analyzing late deliveries can map:
- Suppliers: Distribution centers.
- Inputs: Order data, vehicles, drivers.
- Process: Packaging → Loading → Transport → Delivery.
- Outputs: On-time deliveries.
- Customers: Store managers.
This ensures everyone understands the full system and dependencies.
4. Failure Modes and Effects Analysis (FMEA)
FMEA is a structured method for identifying potential failure points, assessing their impact, and prioritizing which risks to mitigate first.
Each potential failure is scored by:
- Severity (S)
- Occurrence (O)
- Detection (D)
The product of these gives the Risk Priority Number (RPN).
Use Case: In a software release cycle, teams use FMEA to identify where errors could disrupt customer experience—prioritizing fixes for the highest-risk modules.
5. Process Mapping
A Process Map or Flowchart visually shows every step of a process from start to finish. It helps identify bottlenecks, redundancies, and unnecessary complexity.
By mapping “as-is” and “to-be” processes, teams make improvement plans more concrete.
Use Case: A bank analyzing loan approvals discovers multiple redundant verification steps. Simplifying them reduces turnaround time by 40%.
6. Histogram
A Histogram is a simple bar graph that shows the distribution of data—such as defect counts, delivery times, or production yields.
It helps identify whether data is skewed, clustered, or variable, guiding improvement strategies.
Use Case: A Six Sigma team reviewing cycle times might find that most tasks take between 6–8 hours, but a few outliers take 20+ hours—signaling process inconsistency.
7. Scatter Diagram
When you suspect a relationship between two variables—like machine temperature and defect rate—a Scatter Diagram helps visualize correlation.
If the points form a pattern, you have evidence of a relationship worth deeper investigation.
8. Value Stream Mapping (VSM)
A Lean-Six Sigma favorite, Value Stream Mapping visualizes the flow of materials and information required to deliver a product or service.
It identifies non-value-added steps, helping teams eliminate waste and improve lead time.
Use Case: A manufacturing plant uses VSM to cut down idle time between production and packaging, reducing total lead time from 12 hours to 7.
9. Cause-and-Effect Matrix
This tool quantifies how different process inputs (causes) affect outputs (effects). Each relationship is scored to prioritize which factors have the greatest impact on quality.
It’s an excellent bridge between brainstorming and statistical validation.
10. Gemba Walk
Borrowed from Lean, a Gemba Walk means “go and see.” Leaders physically observe the process where work happens to gain firsthand insights into problems, instead of relying only on reports.
Combining Gemba with Six Sigma tools creates a powerful culture of continuous improvement.
✔️ Integrating the Tools in the DMAIC Cycle
Six Sigma tools aren’t standalone—they’re most powerful when aligned with the DMAIC framework:
| DMAIC Phase | Key Objective | Typical Tools Used |
|---|---|---|
| Define | Identify the problem and customer needs | SIPOC, Voice of Customer (VOC), Project Charter |
| Measure | Collect reliable data | Control Charts, Histograms, Data Collection Forms |
| Analyze | Identify root causes | Fishbone Diagram, 5 Whys, Pareto Chart, Scatter Diagram |
| Improve | Develop and test solutions | FMEA, Process Mapping, Brainstorming |
| Control | Sustain improvements | Control Charts, Standard Work, Audits |
Using the right tool at the right phase ensures clarity, accuracy, and sustainable success.
☑️ Everyday Application of Six Sigma Tools
You don’t need to be a certified Black Belt to use Six Sigma tools effectively. Many can be applied in daily operations across industries.
In Manufacturing
- Use Fishbone to explore why machine downtime increased.
- Apply Control Charts to monitor defect trends.
- Implement FMEA for predictive maintenance.
In Healthcare
- Use 5 Whys to investigate delays in lab results.
- Apply SIPOC to redesign patient admission workflows.
- Use Pareto Charts to prioritize the most frequent safety incidents.
In IT and Software
- Apply Fishbone to analyze recurring bugs.
- Use Process Mapping to improve deployment pipelines.
- Combine FMEA with Agile retrospectives to prevent future sprints from repeating issues.
In Services and Education
- Use 5 Whys for understanding low satisfaction survey results.
- Apply Value Stream Mapping to shorten response times.
- Implement Control Charts for monitoring performance metrics over time.
The beauty of Six Sigma is its adaptability—it’s not confined to factories or quality labs; it’s a mindset of disciplined problem-solving.
✔️ Best Practices for Using Six Sigma Tools
- Involve cross-functional teams – Different perspectives uncover hidden causes.
- Base conclusions on data, not opinions.
- Use visuals. Tools like Fishbone or Pareto are far more impactful when presented visually.
- Validate root causes before acting—avoid jumping to conclusions.
- Keep improving—document learnings, standardize solutions, and revisit processes regularly.
➡️ Common Mistakes to Avoid
- Stopping too early: Teams often stop at the first “why.” Always go deeper.
- Treating tools as paperwork: Six Sigma tools are not just forms—they’re thought processes.
- Ignoring the human factor: Many root causes are behavioral, not just technical.
- Failing to control improvements: Without a control phase, problems reappear.
☑️ The Future of Six Sigma Tools: AI and Automation
Modern organizations are now combining Six Sigma methodologies with AI-driven analytics.
- Machine learning can detect process anomalies faster than manual charts.
- Natural language processing (NLP) tools can extract insights from customer complaints automatically.
- Digital dashboards now replace static Pareto charts, offering real-time visibility into process performance.
AI doesn’t replace Six Sigma—it amplifies it, making data collection, visualization, and predictive analysis easier and faster.
Six Sigma remains one of the most practical, results-oriented approaches to problem-solving in modern business. The Fishbone Diagram and 5 Whys are timeless for uncovering root causes, but the true strength of Six Sigma lies in its ecosystem of tools—from Pareto Charts to FMEA and beyond.
Whether you’re a project manager, analyst, or team leader, applying these tools daily helps you move from reacting to problems toward preventing them altogether.
In the end, Six Sigma isn’t about statistics or charts—it’s about a mindset of continuous improvement, structured thinking, and evidence-based decisions. Use these tools not just as quality instruments but as a professional habit, and you’ll see measurable, lasting impact in every process you touch.
☑️ Software That Supports Project Managers in Using Six Sigma Tools
Modern project managers don’t have to rely on spreadsheets or whiteboards to apply Six Sigma tools. A new generation of software platforms integrates Fishbone diagrams, 5 Whys templates, and advanced analytics into daily workflows—helping teams visualize problems, identify root causes, and monitor improvements faster than ever.
1. Minitab
One of the most established Six Sigma software solutions, Minitab specializes in statistical analysis and process control.
It includes ready-made templates for Fishbone Diagrams, Pareto Charts, Control Charts, and FMEA scoring. Minitab automatically performs statistical tests such as ANOVA and regression, making it ideal for data-heavy DMAIC projects.
✔️ Best for: Quality engineers, Six Sigma Black Belts, and analysts who need deep statistical validation.
2. Microsoft Visio and Lucidchart
Both Visio and Lucidchart allow teams to design professional Fishbone Diagrams and Process Maps collaboratively.
Their drag-and-drop interfaces simplify brainstorming sessions, while integrations with Microsoft 365 and Google Workspace make sharing visuals effortless.
✔️ Best for: Project managers seeking visual clarity and collaborative documentation.
3. Miro
Miro brings Six Sigma collaboration into the cloud. With pre-built Fishbone Diagram and 5 Whys templates, real-time sticky notes, and integrations with Slack, Jira, and Asana, Miro helps distributed teams work through root cause analysis visually.
✔️ Best for: Agile and remote project managers running virtual Kaizen or RCA sessions.
4. SigmaXL and JMP
These Excel-based and standalone statistical tools provide accessible Lean Six Sigma functionality without the steep learning curve of Minitab.
They include control charts, Pareto analysis, regression tools, and process capability studies—all inside a familiar interface.
✔️ Best for: Small- to medium-sized organizations adopting data-driven decision-making without full-scale Six Sigma deployment.
5. Monday.com, Smartsheet, and ClickUp
While not exclusively Six Sigma tools, these project management platforms support process improvement initiatives by enabling:
- Real-time tracking of DMAIC stages.
- Dashboards for KPIs and defect rates.
- Integrations with reporting tools for Pareto or Control Chart visualizations.
They help project managers embed Six Sigma discipline into everyday execution, ensuring every improvement project stays aligned with measurable outcomes.
✔️ Best for: Project managers blending Lean, Agile, and Six Sigma methodologies across teams.
6. Power BI and Tableau
When Six Sigma meets data visualization, tools like Power BI and Tableau transform raw process data into actionable insights.
Project managers can connect real-time metrics—cycle times, defects, delays—and create interactive dashboards that act as living Control Charts or Pareto reports.
✔️ Best for: Leaders seeking continuous visibility and performance monitoring across departments.
7. Freshservice and ServiceNow (for IT & Operations)
In IT-driven environments, Six Sigma thinking merges with IT Service Management (ITSM) tools like Freshservice or ServiceNow.
These platforms allow project managers to apply 5 Whys to recurring incidents, perform trend analysis, and use workflow automation to eliminate root causes.
✔️ Best for: IT project managers focusing on process reliability and service quality.
Why Software Matters
The right software turns Six Sigma from theory into everyday practice.
Instead of manually drawing diagrams or compiling spreadsheets, project managers can:
- Automate data collection for the Measure phase.
- Visualize cause-effect relationships instantly.
- Track DMAIC progress with real-time dashboards.
- Standardize templates across projects and departments.
Software support ensures that process improvement becomes systematic, repeatable, and scalable—the very essence of Six Sigma success.