➡️ Introduction
Project issues don’t happen randomly. They happen because something caused them — a gap in communication, a process failure, a technical problem, or even a misunderstanding of requirements.
To solve problems effectively, project managers must understand not just what happened, but why it happened.
This is where Root Cause Analysis (RCA) becomes essential.
Top 5 Project Management Software
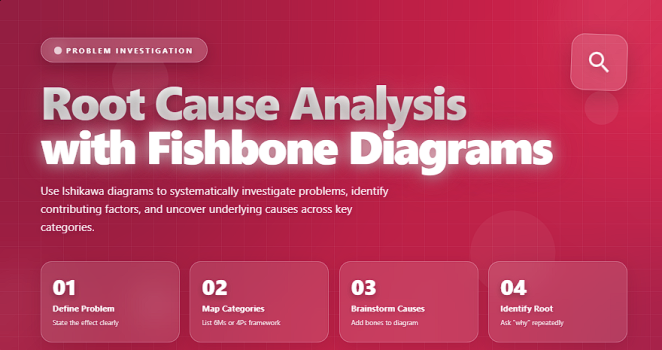
One of the most widely used RCA tools in project management is the Fishbone Diagram, also known as the Ishikawa Diagram or Cause-and-Effect Diagram.
It helps teams visually break down all possible causes behind a problem, making it easier to discover the true root cause and implement long-term corrective actions.
✅ What Is Root Cause Analysis (RCA)?
Root Cause Analysis is a structured investigation technique for identifying the underlying causes of a problem rather than treating symptoms.
RCA helps project managers:
✔️ prevent recurring issues
✔️ improve quality and reliability
✔️ strengthen processes
✔️ avoid hidden risks
✔️ make corrective actions more effective
RCA seeks the answer to one critical question:
“What is the fundamental reason this problem happened?”
✅ What Is a Fishbone Diagram?
A Fishbone Diagram visually maps potential causes of a problem across key categories (e.g., People, Process, Technology, Materials).
It resembles the skeleton of a fish — with the “head” representing the problem, and the “bones” representing cause categories.
It helps teams:
✔️ brainstorm more thoroughly
✔️ organize causes systematically
✔️ see connections between causes
✔️ uncover root causes efficiently
✔️ avoid focusing only on obvious symptoms
✅ Common Categories in a Fishbone Diagram
Frameworks used to organize causes during RCA brainstorming.
| Category | Description | Typical Causes |
|---|---|---|
| People | Human factors affecting the issue. | Training gaps, workload, errors, miscommunication. |
| Processes | Steps, workflows, or procedures. | Inefficient steps, unclear SOPs, bottlenecks. |
| Technology | Tools, systems, hardware, software. | System crashes, outdated tools, integrations. |
| Materials | Inputs required to perform the work. | Low-quality materials, supply delays. |
| Environment | Conditions affecting performance. | Noise, workspace layout, temperature. |
| Management | Leadership decisions and policies. | Poor planning, unclear priorities. |
✅ How to Build a Fishbone Diagram (Step-by-Step)
✔️ 1. Define the Problem Clearly
Write a specific, measurable problem statement and place it at the “head” of the fish.
Examples:
✔️ “Customer tickets take more than 48 hours to resolve.”
✔️ “Sprint deliverables are consistently delayed.”
A vague problem = vague causes.
✔️ 2. Select the Cause Categories
Choose standard categories (People, Process, Technology…) or customize them for your industry.
✔️ 3. Brainstorm Potential Causes
For each category, ask:
“What could cause this problem?”
Use techniques such as:
✔️ 5 Whys
✔️ silent brainstorming
✔️ cross-functional workshops
Encourage quantity over quality at this stage.
✔️ 4. Drill Down to Root Causes
For each potential cause, continue asking Why? until you reach something truly controllable.
Example:
Issue → Low quality code
Why? → Developers rushed
Why? → Unrealistic sprint commitments
Why? → No estimation standards
✔️ 5. Identify the True Root Cause
A root cause is the factor that, if removed, prevents recurrence.
Avoid mixing symptoms with causes.
✔️ 6. Develop Corrective Actions
Create practical solutions that address root causes directly.
Examples:
✔️ implement coding standards
✔️ revise sprint planning process
✔️ add QA checkpoints
✔️ improve onboarding
✔️ 7. Monitor and Verify Effectiveness
A solution is only successful if:
✔️ the issue disappears
✔️ it does not recur
✔️ no new unintended issues appear
Track progress using KPIs, reports, and follow-up reviews.
🛠️ Tools for Creating Fishbone Diagrams
✔️ Miro
✔️ Lucidchart
✔️ Mural
✔️ Microsoft Visio
✔️ Canva
✔️ Whiteboards during live workshops
❌ Common Mistakes to Avoid
❌ Jumping to solutions without analysis
❌ Stopping at symptoms instead of root causes
❌ Blaming individuals instead of evaluating processes
❌ Using too many categories
❌ Not involving the right people
⭐ Best Practices
✔️ Keep problem statements specific
✔️ Use cross-team brainstorming
✔️ Validate root causes with data
✔️ Combine Fishbone with 5 Whys
✔️ Document decisions and follow-ups
⭐ Final Thoughts
A Fishbone Diagram is one of the most effective tools for uncovering root causes and improving quality in any project.
When used correctly, it transforms problems into learning opportunities and strengthens your team’s ability to prevent failures rather than react to them.
Great project managers don’t guess —
they investigate until the truth becomes clear.