➡️ Introduction
Dependencies are rarely the problem.
Invisible dependencies are.
Top 5 Project Management Software
Most schedule delays, resource conflicts, and surprise blockers come from dependencies that exist in reality but are not visible in planning tools. When teams cannot clearly see how work is connected, they make local decisions that create global delays.
Tools to visualize dependencies are not about adding complexity.
They are about making cause-and-effect visible.
This article explains why dependency visualization matters, the types of tools that support it, and how project managers should use these tools to reduce risk and improve decision-making.
✅ Why Visualizing Dependencies Is Critical
Dependencies define how work flows across tasks, teams, and systems.
When dependencies are clearly visualized:
✔️ delays are detected earlier
✔️ impact analysis becomes faster
✔️ bottlenecks are easier to identify
✔️ cross-team coordination improves
✔️ schedule risk becomes visible, not hidden
Without visualization, dependencies exist only in people’s heads — and that is where projects lose control.
✅ What Makes a Dependency “Visible”
A dependency is visible when a tool clearly shows:
✔️ what depends on what
✔️ the direction of the dependency
✔️ the timing impact of delays
✔️ the owner of each dependent task
✔️ where multiple dependencies converge
Visibility is not just lines between tasks —
it is clarity of consequence.
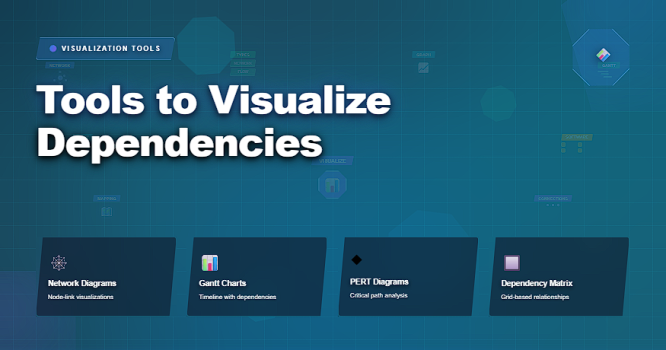
✅ Tools to Visualize Dependencies
How different tools make task relationships and impacts visible.
| Tool Type | What It Visualizes | Best Use Case |
|---|---|---|
| Gantt Charts | Task sequences and finish/start relationships | Milestone-driven and predictive schedules |
| Network Diagrams | Logical task flow and critical paths | Analyzing schedule logic and dependencies |
| Kanban Boards | Flow dependencies and blocked work | Continuous delivery and Agile teams |
| Roadmaps | High-level dependencies across initiatives | Executive and portfolio alignment |
| Dependency Maps | Cross-team and system-level dependencies | Complex, multi-team environments |
| Dashboards | Risk hotspots and delayed dependency chains | Ongoing monitoring and decision support |
✅ Choosing the Right Visualization Tool
No single tool fits all dependency types.
Project managers should choose tools based on:
✔️ level of detail required
✔️ audience (team vs executives)
✔️ project complexity
✔️ rate of change
✔️ number of cross-team dependencies
The goal is clarity, not decoration.
✅ How to Use Dependency Visualization Effectively
Tools only help if used correctly.
Effective practices include:
✔️ updating dependencies as work changes
✔️ highlighting critical dependency chains
✔️ making blocked work visible
✔️ reviewing dependencies during planning meetings
✔️ assigning clear ownership to dependencies
✔️ using visuals to support conversations, not replace them
Visualization should drive action.
❌ Common Mistakes in Dependency Visualization
❌ drawing dependencies once and never updating them
❌ visualizing tasks but ignoring ownership
❌ creating overly complex diagrams
❌ hiding dependencies in notes or comments
❌ assuming everyone interprets visuals the same way
A dependency that cannot be understood quickly is not truly visible.
⭐ Best Practices
✔️ visualize dependencies at the right level
✔️ keep diagrams simple and purposeful
✔️ review dependency views regularly
✔️ connect dependencies to risk discussions
✔️ adapt visualization tools as project maturity grows
✔️ ensure dependency visibility across teams
⭐ Final Thoughts
Dependencies drive schedules — whether they are visible or not.
Strong project managers do not rely on memory or assumptions. They use tools that make dependencies explicit, understandable, and actionable.
Projects succeed not because dependencies disappear —
but because they are seen early and managed deliberately.