
➡️ Introduction
Many schedules look detailed — but still fail to explain how work actually flows.
Top 5 Project Management Software
That is because dates and bars alone do not reveal logic. They show when tasks happen, but not why one task depends on another or how delays propagate through the project.
Network diagrams solve this problem.
They strip schedules down to their core logic and make dependencies, sequencing, and critical paths explicit and visible. When used correctly, network diagrams transform complex schedules from static plans into understandable systems.
This article explains what network diagrams are, why they matter, how to use them effectively, and how they improve clarity in complex projects.
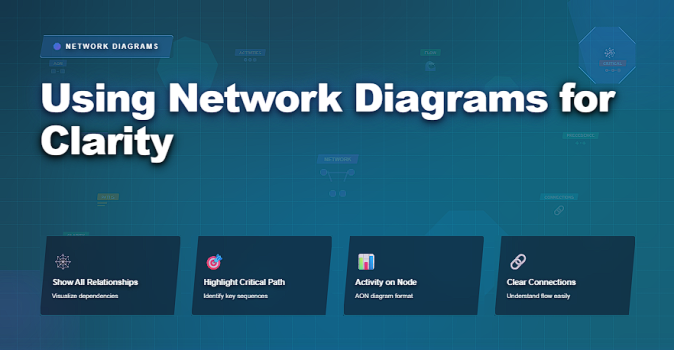
✅ What a Network Diagram Really Is
A network diagram is a logical representation of task relationships.
Instead of focusing on dates, it focuses on:
✔️ sequence
✔️ dependency direction
✔️ parallelism
✔️ constraint points
✔️ critical paths
In a network diagram:
• tasks are nodes (or arrows)
• dependencies are connections
• logic drives the schedule
Dates come later — logic comes first.
✅ Why Network Diagrams Improve Clarity
Network diagrams answer questions that Gantt charts often hide:
✔️ Which tasks truly control the schedule?
✔️ Where can work happen in parallel?
✔️ What happens if this task slips?
✔️ Which dependencies are artificial vs mandatory?
✔️ Where does risk concentrate?
They make cause and effect visible, which is essential for decision-making.
✅ What Network Diagrams Make Clear
Insights that are difficult to see in timeline-based views.
| Aspect | What Becomes Visible | Why It Matters |
|---|---|---|
| Critical Path | Tasks with zero float | Any delay impacts project finish |
| Parallel Work | Tasks that can run simultaneously | Improves flow and compression options |
| Logical Gaps | Missing or incorrect dependencies | Prevents fragile schedules |
| Dependency Convergence | Multiple paths feeding one task | Highlights bottlenecks and risk points |
| Float Distribution | Where schedule flexibility exists | Supports better trade-off decisions |
✅ When Network Diagrams Are Most Useful
Network diagrams are especially powerful when:
✔️ schedules are complex or highly interdependent
✔️ teams argue about “what’s blocking what”
✔️ deadlines feel unrealistic but reasons are unclear
✔️ compression or acceleration is being considered
✔️ risk analysis is required
✔️ stakeholders need logic explained, not dates
They are thinking tools, not just reporting tools.
✅ How to Use Network Diagrams Effectively
To get real value:
✔️ build the network before assigning dates
✔️ validate logic with the delivery team
✔️ remove unnecessary dependencies
✔️ identify and protect the critical path
✔️ update logic when scope changes
✔️ use the diagram during planning discussions
Network diagrams should support conversation and reasoning, not live in isolation.
❌ Common Mistakes with Network Diagrams
❌ treating them as academic artifacts
❌ building them once and never updating
❌ overcomplicating with unnecessary detail
❌ assuming software-generated logic is correct
❌ using dates instead of logic to “fix” problems
A network diagram is only as good as the thinking behind it.
⭐ Best Practices
✔️ start simple and refine
✔️ focus on logic before optimization
✔️ use network diagrams to test scenarios
✔️ combine with Gantt views, not replace them
✔️ revisit diagrams when constraints change
✔️ use them to explain decisions, not defend them
⭐ Final Thoughts
Network diagrams bring clarity where timelines alone fall short.
They reveal how work truly connects, where risk concentrates, and why schedules behave the way they do. For complex projects, they are not optional — they are essential.
Projects succeed not because plans are detailed —
but because their logic is understood.